Tropical cyclones form over the warm waters of the tropical and subtropical regions. Powerful winds coupled with heavy rainfall and damaging storm surges create a destructive combination for low-lying coastal communities where flood inundation is always a risk.
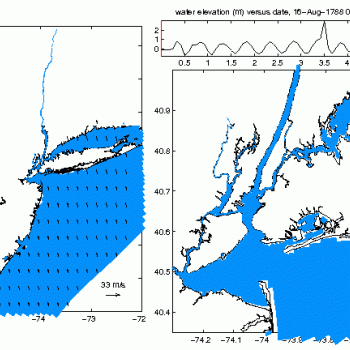
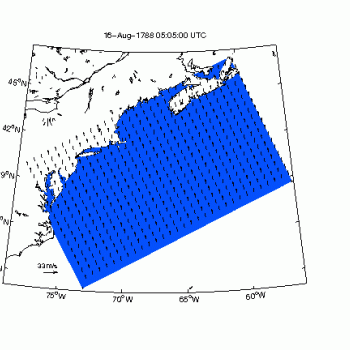
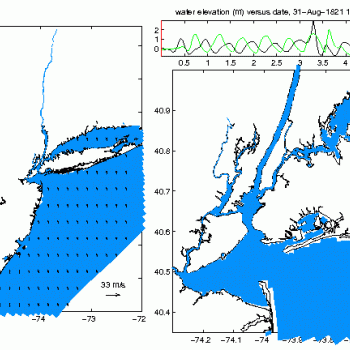
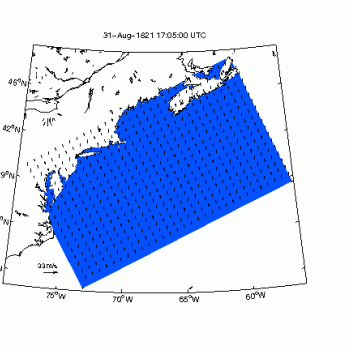
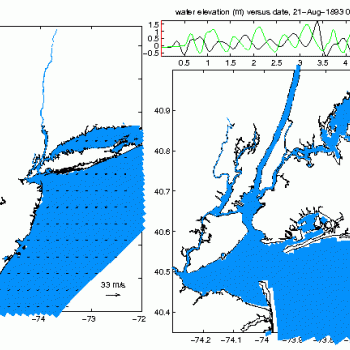
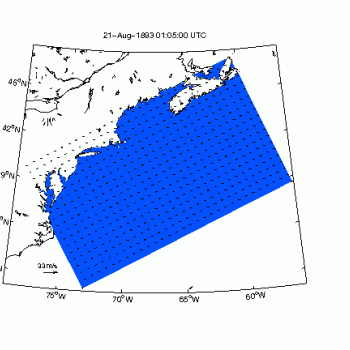
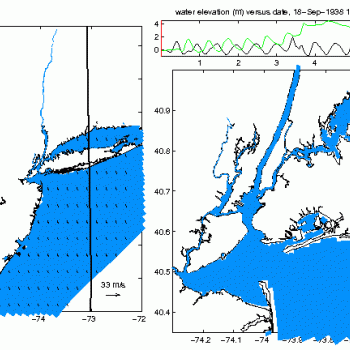
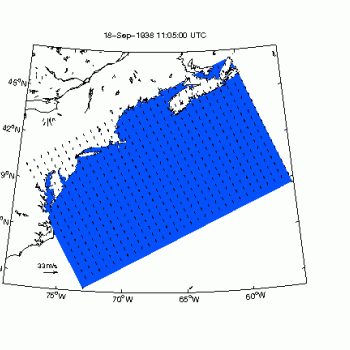
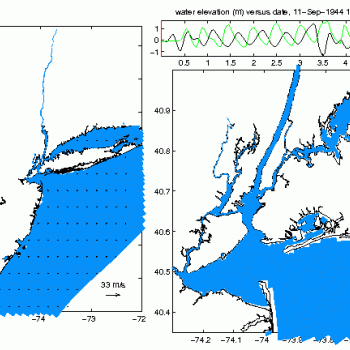
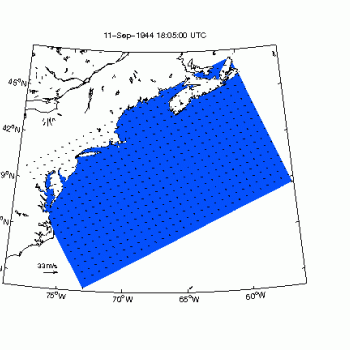
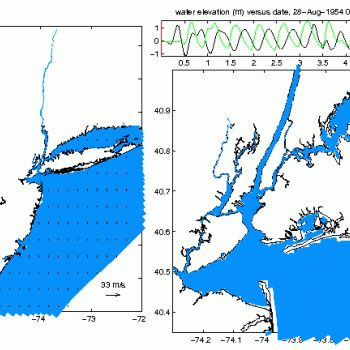
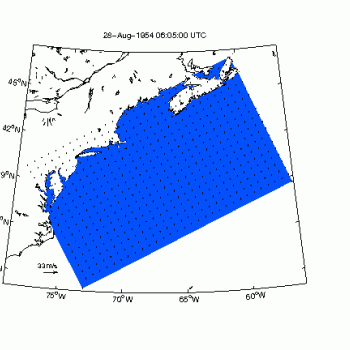
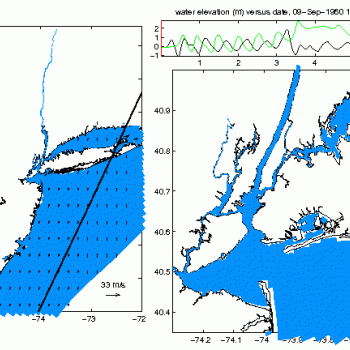
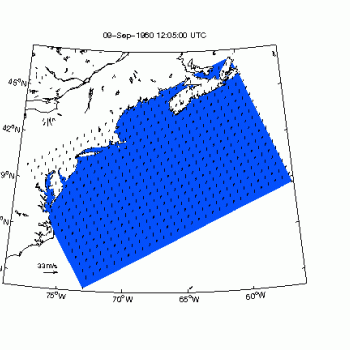
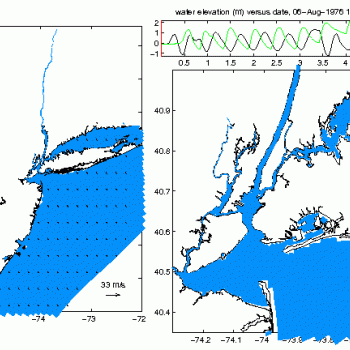
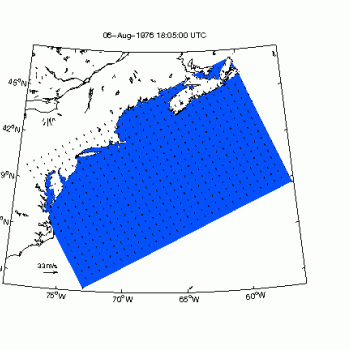
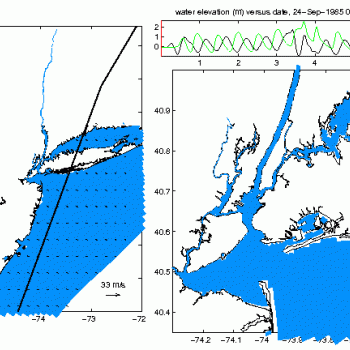
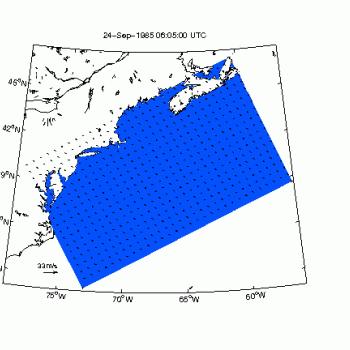
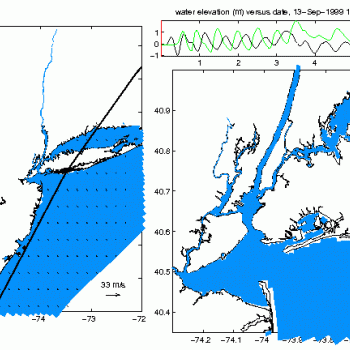
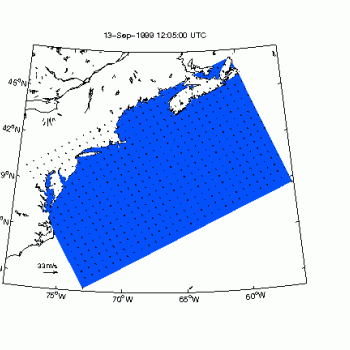
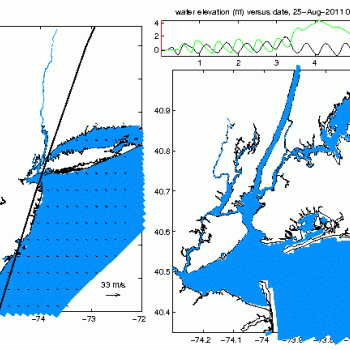
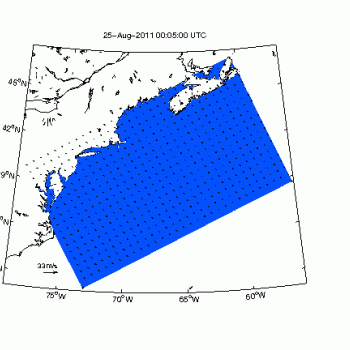
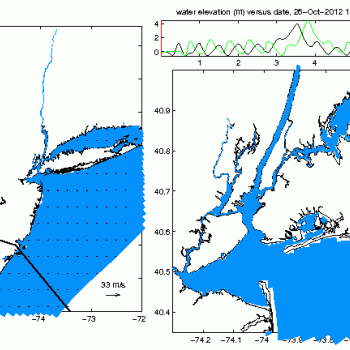
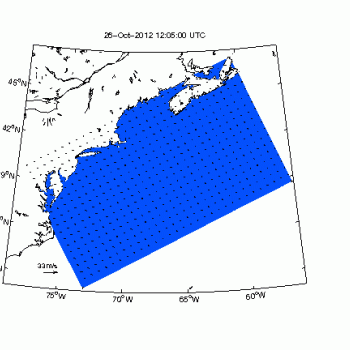
Below are sample animations of historical flood events, caused by tropical cyclones, used in developing the Hudson River Flood Decision Support System.
The map animations show colors for water level, arrow vectors for wind velocity, and black or white lines for isobars (lines of constant atmospheric pressure). Some tropical cyclone maps also show the storm track as a unmoving black line. Inset x-y axes for some animations also show the time history of the water level for New York Harbor (black) and Albany (green).
