Related Resources
HRFIDSS Documentation
The Data Dictionary contains information about each data layer used in the Hudson River Flood Mapper, including the data source link and date accessed.
The Technical Report includes all important information regarding the Hudson River Flooding Decision Support System Version 2.
New York State Building Footprints with Flood Analysis Resources
The technical report for New York State Building Footprints with Flood Analysis can be found here. Please consult this report for information about the methodologies our research team employed.
Users can find the data dictionary for New York State Building Footprints with Flood Analysis here.
For dataset-specific metadata, please refer to the buildings footprint, damages, and flood grid metadata
Users are free to use the data for research, government, or commercial purposes with appropriate attribution. Sale of the data or charging for access to the data is expressly prohibited.
Email question or comments to: nyserda@ciesin.columbia.edu
Regional Level Data Download
Users can download statistical data of flooding impacts on populations, facilities, and buildings by clicking the "Download Statistics" button in the upper right hand portion of the mapper.
Below are examples of statistics available for download. The results are split into three spreadsheets: Critical Infrastructure, Natural Resilience, and Social Vulnerability.
Critical_Infrastructure_Statistics.xls
The critical infrastructure results include a summary of the number of structures in each of the infrastructure data layers in your municipality that fall within the flood zone for each flood scenario. Also included in the results are summary statistics for potential loss estimates (in both dollar amounts and numbers of buildings).
Natural_Resilience_Statistics.xls
Natural areas like forests, wetlands, and floodplains are vital assets to consider in assessing vulnerability and planning for resilience. In contrast to impervious developed areas, these natural features retain, slow, filter, and infiltrate water to the soil, reducing erosion and flood impacts. Conserving and managing natural assets is thus an important resilience strategy.
Social_Vulnerability_Index_2007_2011.xls
The social vulnerability results include a full description of how the index was calculated, the variables used for the calculation, and the Social Vulnerability Index summarized at the municipal and block group level. Also included are the decile ranks of each township for each dimension of vulnerability and aggregate score. A high score or ranking indicates high vulnerability, while a low score or ranking indicates low vulnerability. Used together with the Social Vulnerability layers, the results allow you to compare vulnerabilities both within your municipality and against other municipalities.
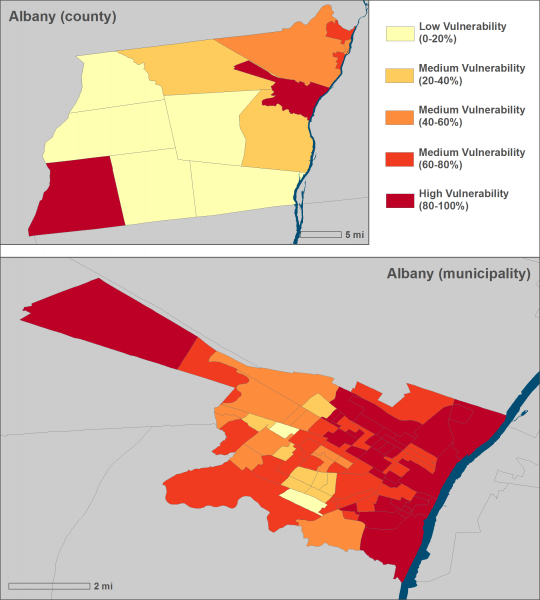
Social Vulnerability Index
CIESIN's Social Vulnerability Index measures the vulnerability of US census block groups and townships to environmental hazards. Demographic information from the 2007–2011 American Community Survey was used to develop the index and identify areas where particularly at-risk populations live. Below is an example of the two scales of SoVI data available for download. The upper map displays SoVI data at the municipality level while the lower map shows SoVI data at the block group level. For more information on how the Social Vulnerability Index was developed see our technical report.